C2AI
What it is
C2AI answers a plain-English question about residential electrification data with SQL, statistics, and charts. I built it with Cedric Clyburn (Red Hat). The model is Qwen3.6-35B-A3B, served from Red Hat’s LiteLLM endpoint.
How it works
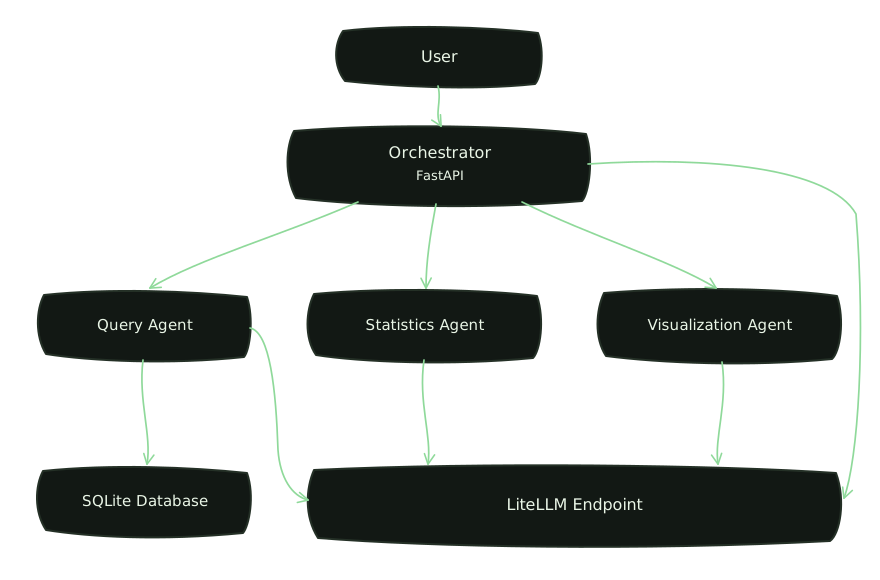
A FastAPI orchestrator splits the question and hands the pieces to three agents. The query agent writes SQL. The statistics agent reads the numbers. The visualization agent draws matplotlib charts. The query agent is the sole path to the database: it exposes an MCP server, and the other agents ask it for rows. The orchestrator streams the report back over server-sent events.
Docker Compose runs the stack locally. The database is SQLite, loaded with a synthetic sample of 500 buildings across 10 U.S. states. OpenTelemetry sends distributed traces to Grafana. The browser UI is HTML, JavaScript, and CSS, served by nginx, in a Vercel-inspired layout.
What it showed
The PyData London demo ran on that synthetic sample. A plain-English question returned a short report: the answer in prose, the statistics beside it, and matplotlib charts in the same stream. The Grafana trace showed which agent ran, which SQL it requested, and how long each step took.
Talks
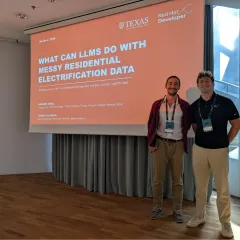
Cedric Clyburn and I gave a 45-minute talk on C2AI at PyData London on June 7, 2026, and presented the system again at DevBcn 2026 in Barcelona.
// updates
- talkC2AI at DevBcn
- talkC2AI at PyData London